Section 3
Data-driven Animation
What is Data-driven Animation
With data-driven animation, After Effects projects can access data directly from spreadsheets and JSON files (which are a special kind of text file for storing any kind of data in a structured way). If you need to render a daily weather forecast, for example, you could create a project that plots temperature curves based on spreadsheet data. When you update the spreadsheet data, the next render of the project will automatically use this new data. This way, you can easily render new versions of your project without needing to touch the After Effects project at all.
JSON Data Workflow
First, let’s talk about using JSON data. Usually, linking properties to JSON data is a three step process:
This is a very tedious and technical process. So, we wrote a free tool for you that simplifies this process a great deal: mamoworldJSON.
mamoworldJSON
If you want to use JSON files in Ae, do yourself a favor and download our free extension, mamoworldJSON. When you’re on the product page, be sure to also watch the tutorial series there, which will show you how to link a weather report template to a JSON file from start to finish. It covers linking texts, colors, formatting numbers, and even drawing a line graph.
With mamoworldJSON, using JSON data becomes really easy – just select any property in your After Effects project and click the Connect button in mamoworldJSON. The extension then prompts you for a name, which is used to store the property in the JSON file. It then creates a JSON file for you (if it doesn’t already exist), inserts the property into the file, and links this property to it using expressions. So, all you need to do is to select the properties that you want to connect to the JSON data and give them names – mamoworldJSON will take care of putting those names into the JSON file and linking them to the property. Again, for a more comprehensive explanation, please refer to the tutorials on the mamoworldJSON product page.
Spreadsheet Data Workflow
In order to use spreadsheet data in After Effects, you’ll need to export it as a CSV (or TSV) file. Every spreadsheet application, whether it’s Excel, Apple Numbers or Open Office, supports this format. You can then simply import this CSV spreadsheet file into After Effects in the same way as any video or image, and you can also place it as a layer in your composition. However, this layer doesn’t render like videos or images - it just provides data properties, which you can link to other properties within your project. This is what a CSV file looks like, in Open Office and as a layer in After Effects: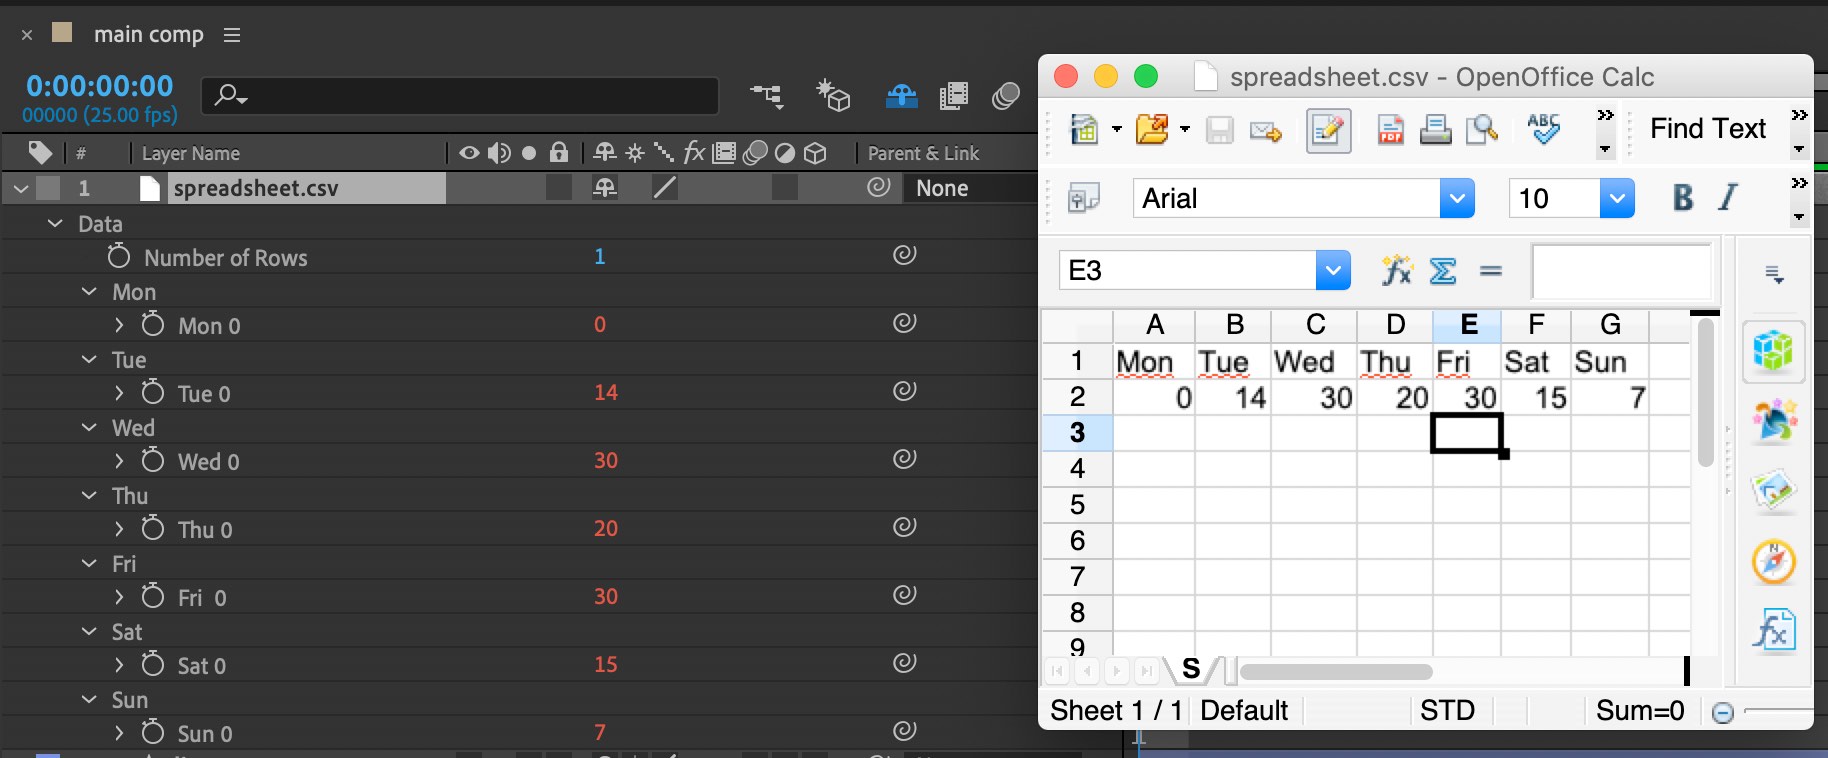 As you can see, all the numbers in the spreadsheet show up as properties in After Effects. If a value is red, this indicates that the numbers cannot be changed in After Effects – they’re connected to the spreadsheet and will instantly update when the spreadsheet changes.
Once you’ve imported a spreadsheet, you can show the values using text layers. Just link the source text of a text layer to the respective data property using the pick-whip in the Parent & Link column of the timeline. The entire process of importing a spreadsheet and linking texts to it is shown in this video.
Of course, you can link any property to these data values. So if you want to create a bar graph, for example, you could create shape layer rectangles and link the height of these rectangles to a spreadsheet value.
Now let’s take a look at a more complex scenario, where we’d like to draw a line graph with a shape layer based on the spreadsheet data. As a first step, we want to place null layers at the data points; the second step is to use expressions to draw a line along those nulls. This video shows how to place the nulls based on the spreadsheet data.
In our example we had one value for each day of the week, so we created seven nulls. We want these to be placed so that the higher their corresponding spreadsheet value is, the higher they are placed in the comp. That means that we should link the y-position of the nulls to the spreadsheet values. We first right-click on the null’s position property and choose Separate Dimensions, which gives us two properties – X Position and Y Position – instead of a single Position property. This is very useful, since we can now link the Y Position to the data but are still able to control the X Position independently.
However, simply linking the Y Position to the spreadsheet data isn’t good enough when drawing graphs, since the value range is usually not exactly what we need. In our example, the values from the spreadsheet range from 0 to 30, but our nulls shouldn’t have y positions between 0 and 30. What we need is a way to map our input values to an output range that fits our comp. This can be done with a linear expression – if you don’t want to write your own expressions code, you can use the Linear Link 1D iExpression within our extension iExpressions.
In our example, we want the largest values (30) to be at a height of y=200, and the lowest values (0) to be at y=800.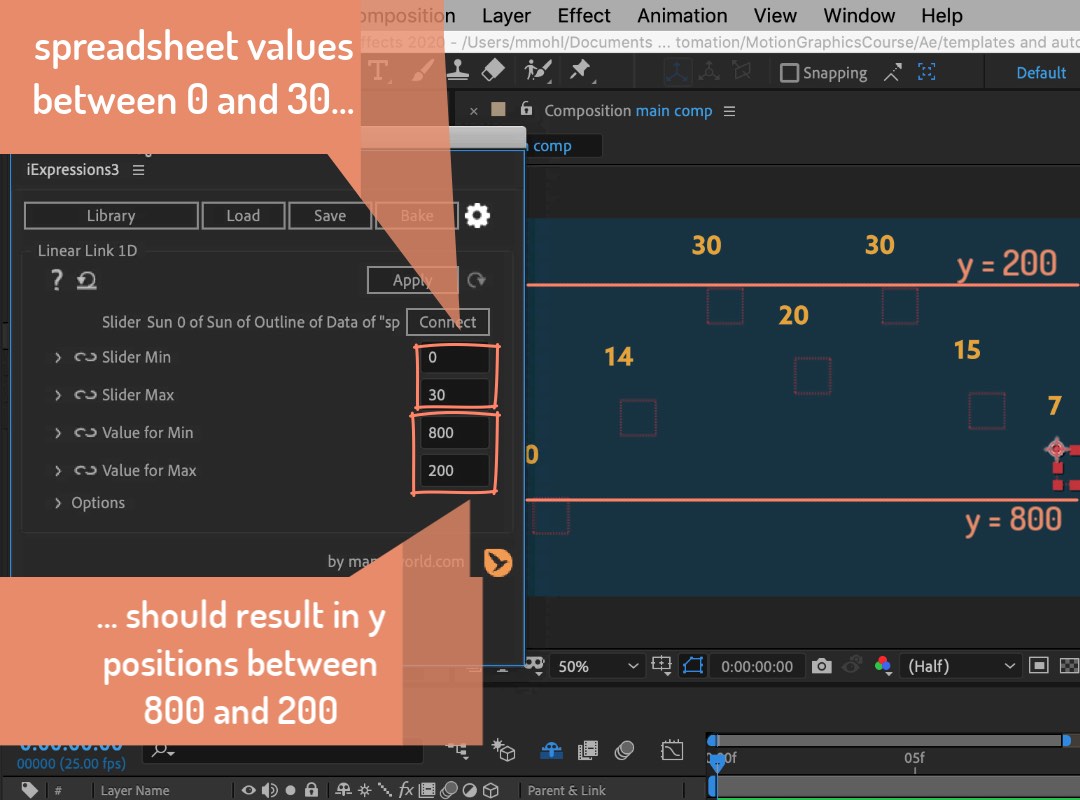 So, in the Linear Link 1D iExpression we’ll set the parameters Slider Min and Slider Max to 0 and 30 respectively, and the Value for Min and Value for Max to 800 and 200, respectively. Above those parameters, the iExpression has a Connect button where we connect our input data, i.e. the respective value from the spreadsheet. After we’ve done this, we can apply the iExpression to the y position of the null. The expression then takes the values from the spreadsheet we’ve connected (with values between 0 and 30) and sets the y position to the corresponding value in our desired output range (800 to 200). So, you might consider this expression as a little calculator that converts values from any input range to a customizable output range.
Once our nulls are in place, the only thing left to do is to draw a line along the null positions. For this, we’ll first create a line on a new shape layer, then use an expression to connect the line path to the null positions. If you don’t own iExpressions, you can use the Create Nulls from Path script, which is included in After Effects. See part 5 of our mamoworldJSON tutorial series for a detailed explanation of this. This tutorial also shows you how to write linear expressions manually, by the way. However, if you own iExpressions, a much more convenient and powerful approach is to use the Connect Multiple Layers iExpression. This tutorial will show you how to use it:
Effectively, in the iExpression you just need to connect the first and last null and choose the option for the expression to draw a single line. With this option, the expression draws a single line along the positions of all layers between the first and last null. Make sure you have no other layers in your comp between the nulls, or else their positions will also be included in the line. 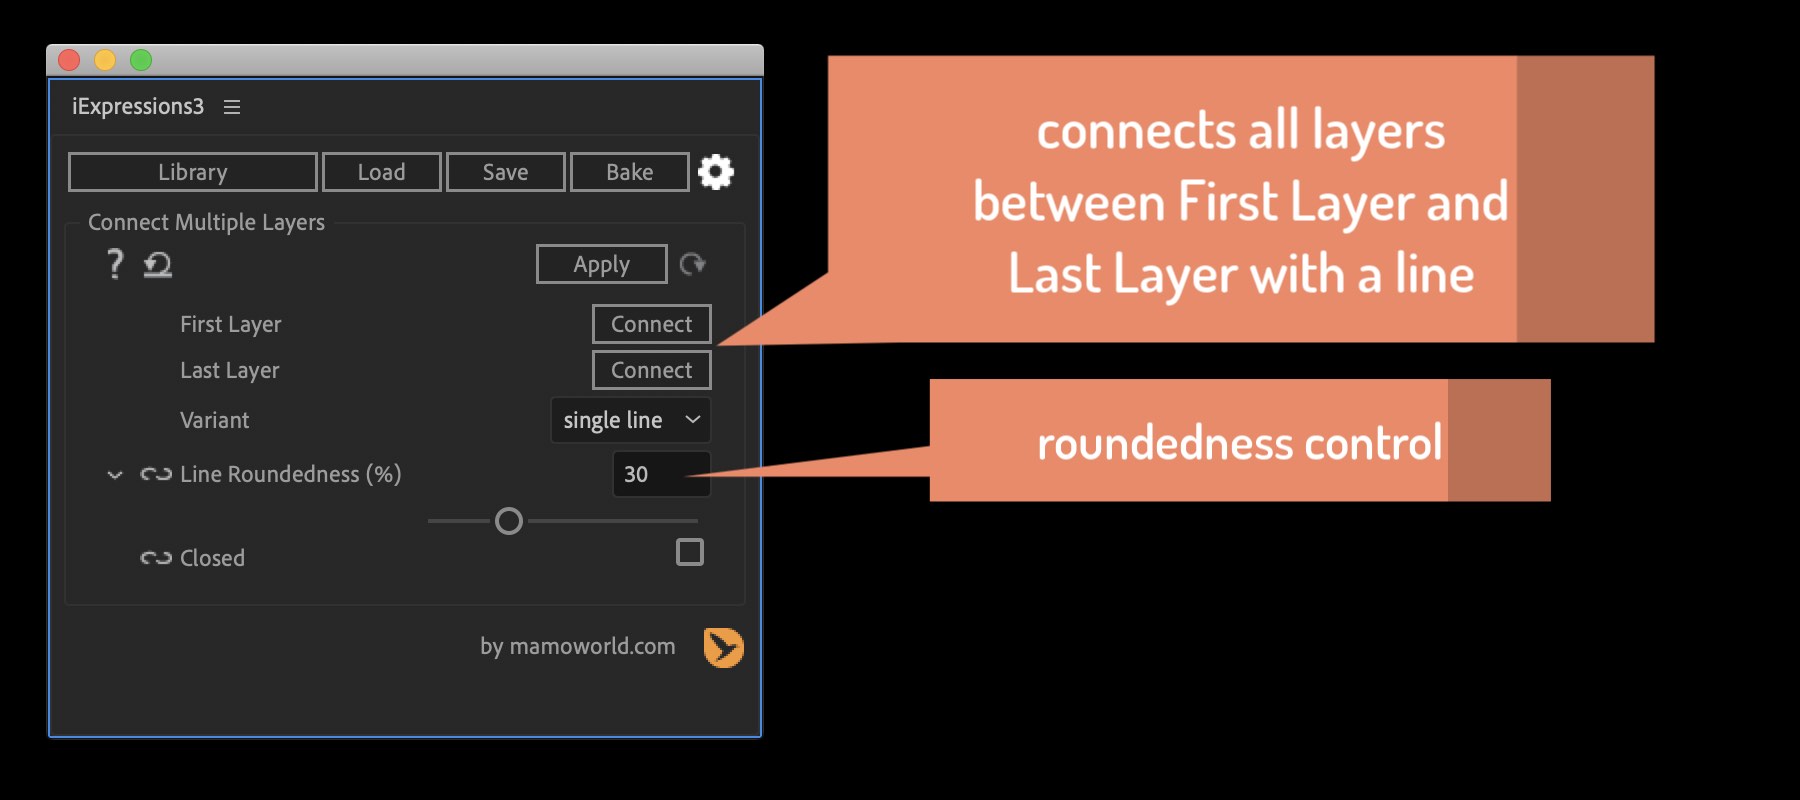 A great feature of this expression is that it offers a roundedness parameter – whereas the Create Nulls from Path script can only connect the null positions with straight lines, the iExpression can also draw smooth curves.
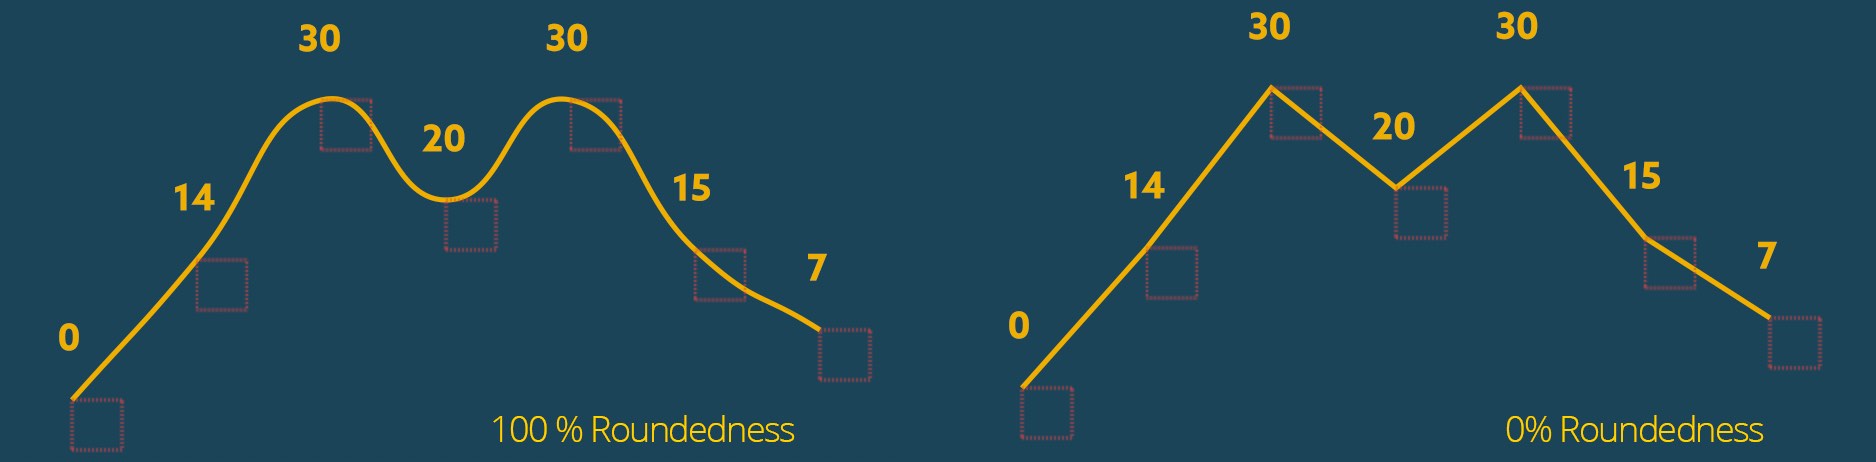
Data-driven Motion Graphics Templates
If you have a data-driven After Effects project that uses a spreadsheet file, you can even turn this project into a motion graphics template and reveal the spreadsheet data in the template. This allows users to modify the spreadsheet data directly from inside Premiere Pro, just as they would with any other template parameter. You just need to drag the data group from your spreadsheet layer onto the Essential Graphics Panel. The full process for this is shown in this video.

Create complex expression-driven templates, character rigs, shape animations and more without writing any code!

Link texts, colors and data from your Ae project to a JSON file.

BeatEdit detects the beats in your music and generates markers for them in your Premiere Pro timeline. Create automatic edits in sync with the music, or let BeatEdit assist your manual editing process.